GWASMind Tutorial
A comprehensive guide to using GWASMind for interactive GWAS visualization and LLM-powered post-GWAS analysis.
Table of Contents
- Getting Started
- Uploading Your GWAS Data
- Interactive Manhattan Plot
- AI Chat Assistant
- Auto Locus Annotation & Gene Prioritization
- API Configuration
1. Getting Started
GWASMind is a web-based tool for visualizing and analyzing Genome-Wide Association Study (GWAS) results. Key features include:
- Interactive Manhattan Plot – Visualize millions of SNPs with smooth zooming and panning
- Lasso Selection – Select regions of interest by drawing directly on the plot
- LLM-Powered Analysis – Get instant insights about selected SNPs using large language models
- Auto Locus Annotation & Gene Prioritization – Automatically annotate significant loci and prioritize candidate causal genes with fine-mapping results with multi-omics functional contexts
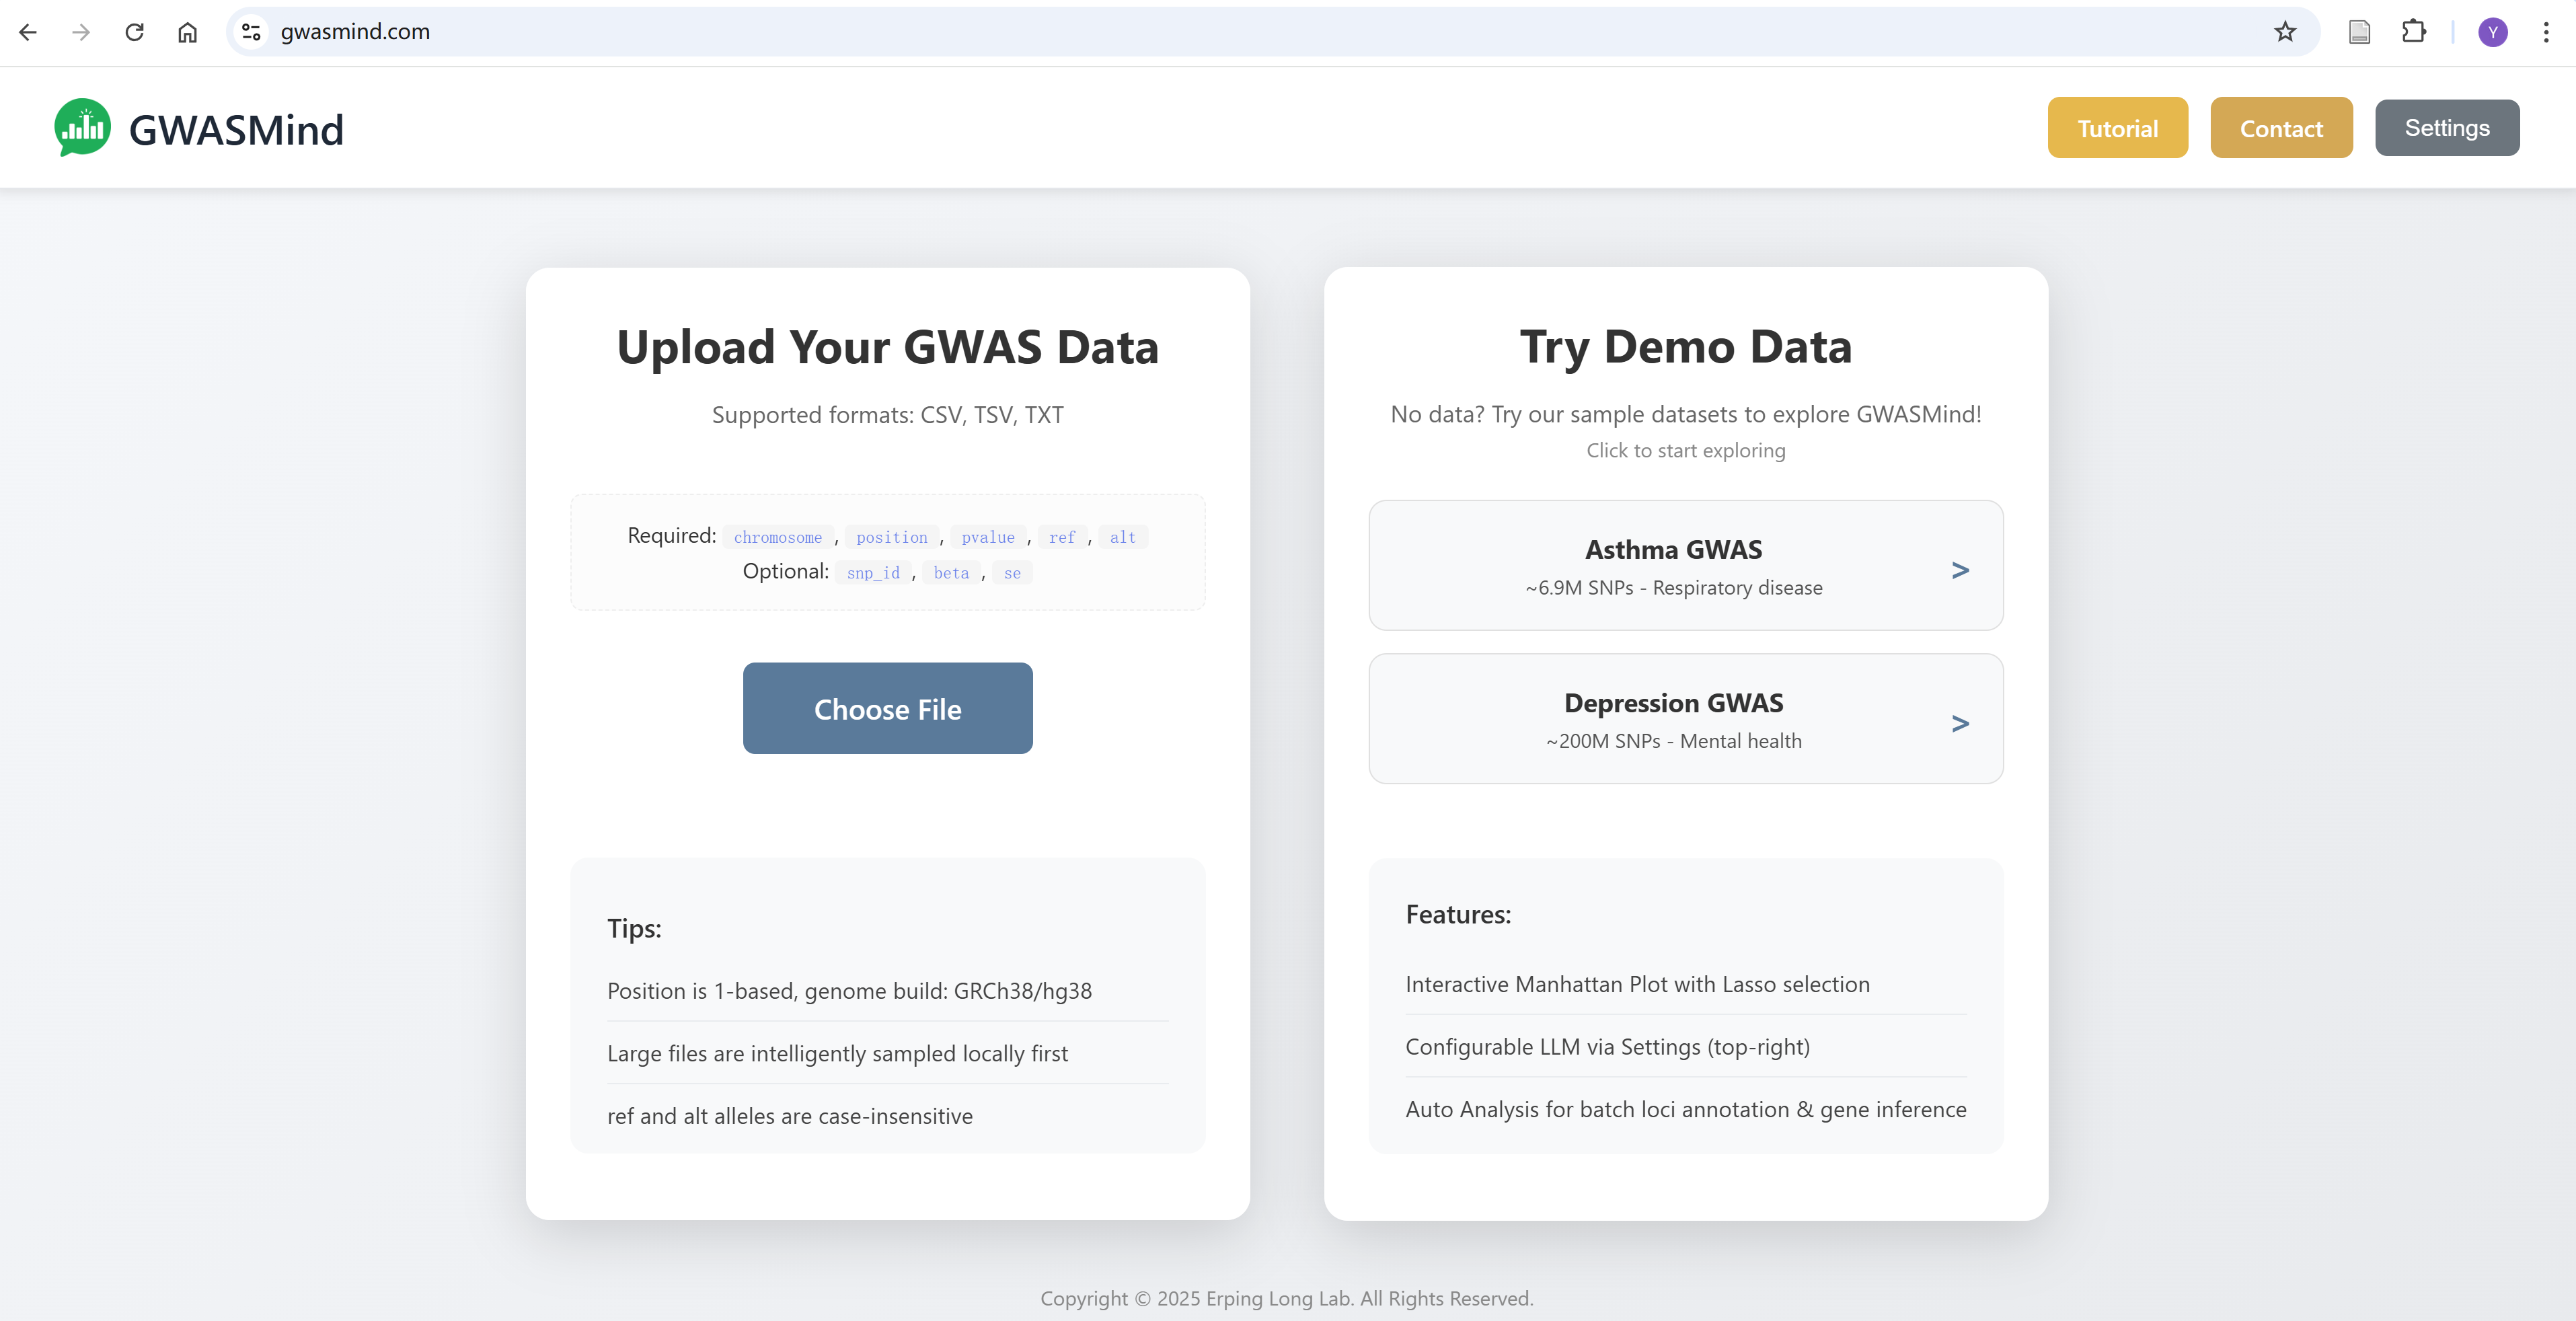
Tip: New to GWASMind? Try our Demo Data (Asthma or Depression GWAS) to explore all features without uploading your own data!
2. Uploading Your GWAS Data
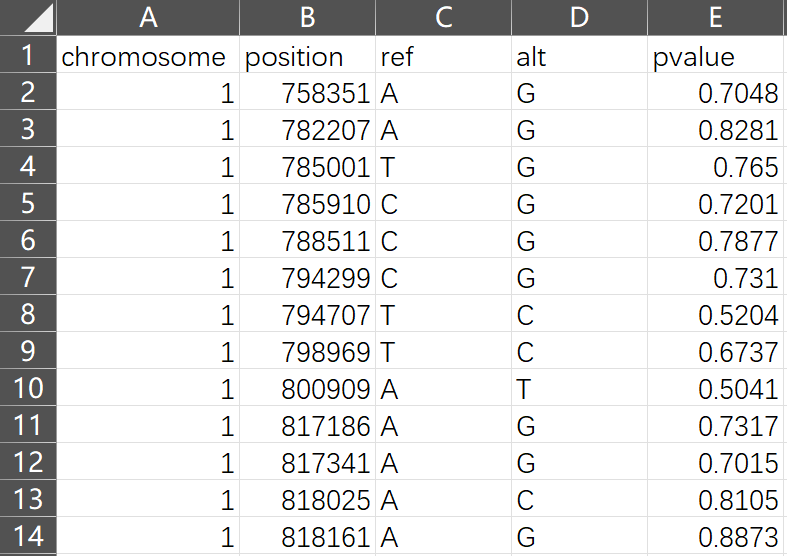
GWASMind accepts GWAS summary statistics in CSV, TSV, or TXT format.
Required Columns
| Column | Description |
|---|---|
chromosome |
Chromosome number (1-22, X, Y, or chr1-chr22) |
position |
Base pair position (1-based) |
pvalue |
P-value from association test |
ref |
Reference allele |
alt |
Alternative allele |
Optional Columns
| Column | Description |
|---|---|
snp_id or rsid |
SNP identifier (rs number) |
beta |
Effect size |
se |
Standard error |
Note: Large datasets (>100K SNPs) will be intelligently sampled to maintain smooth performance while preserving statistically significant SNPs.
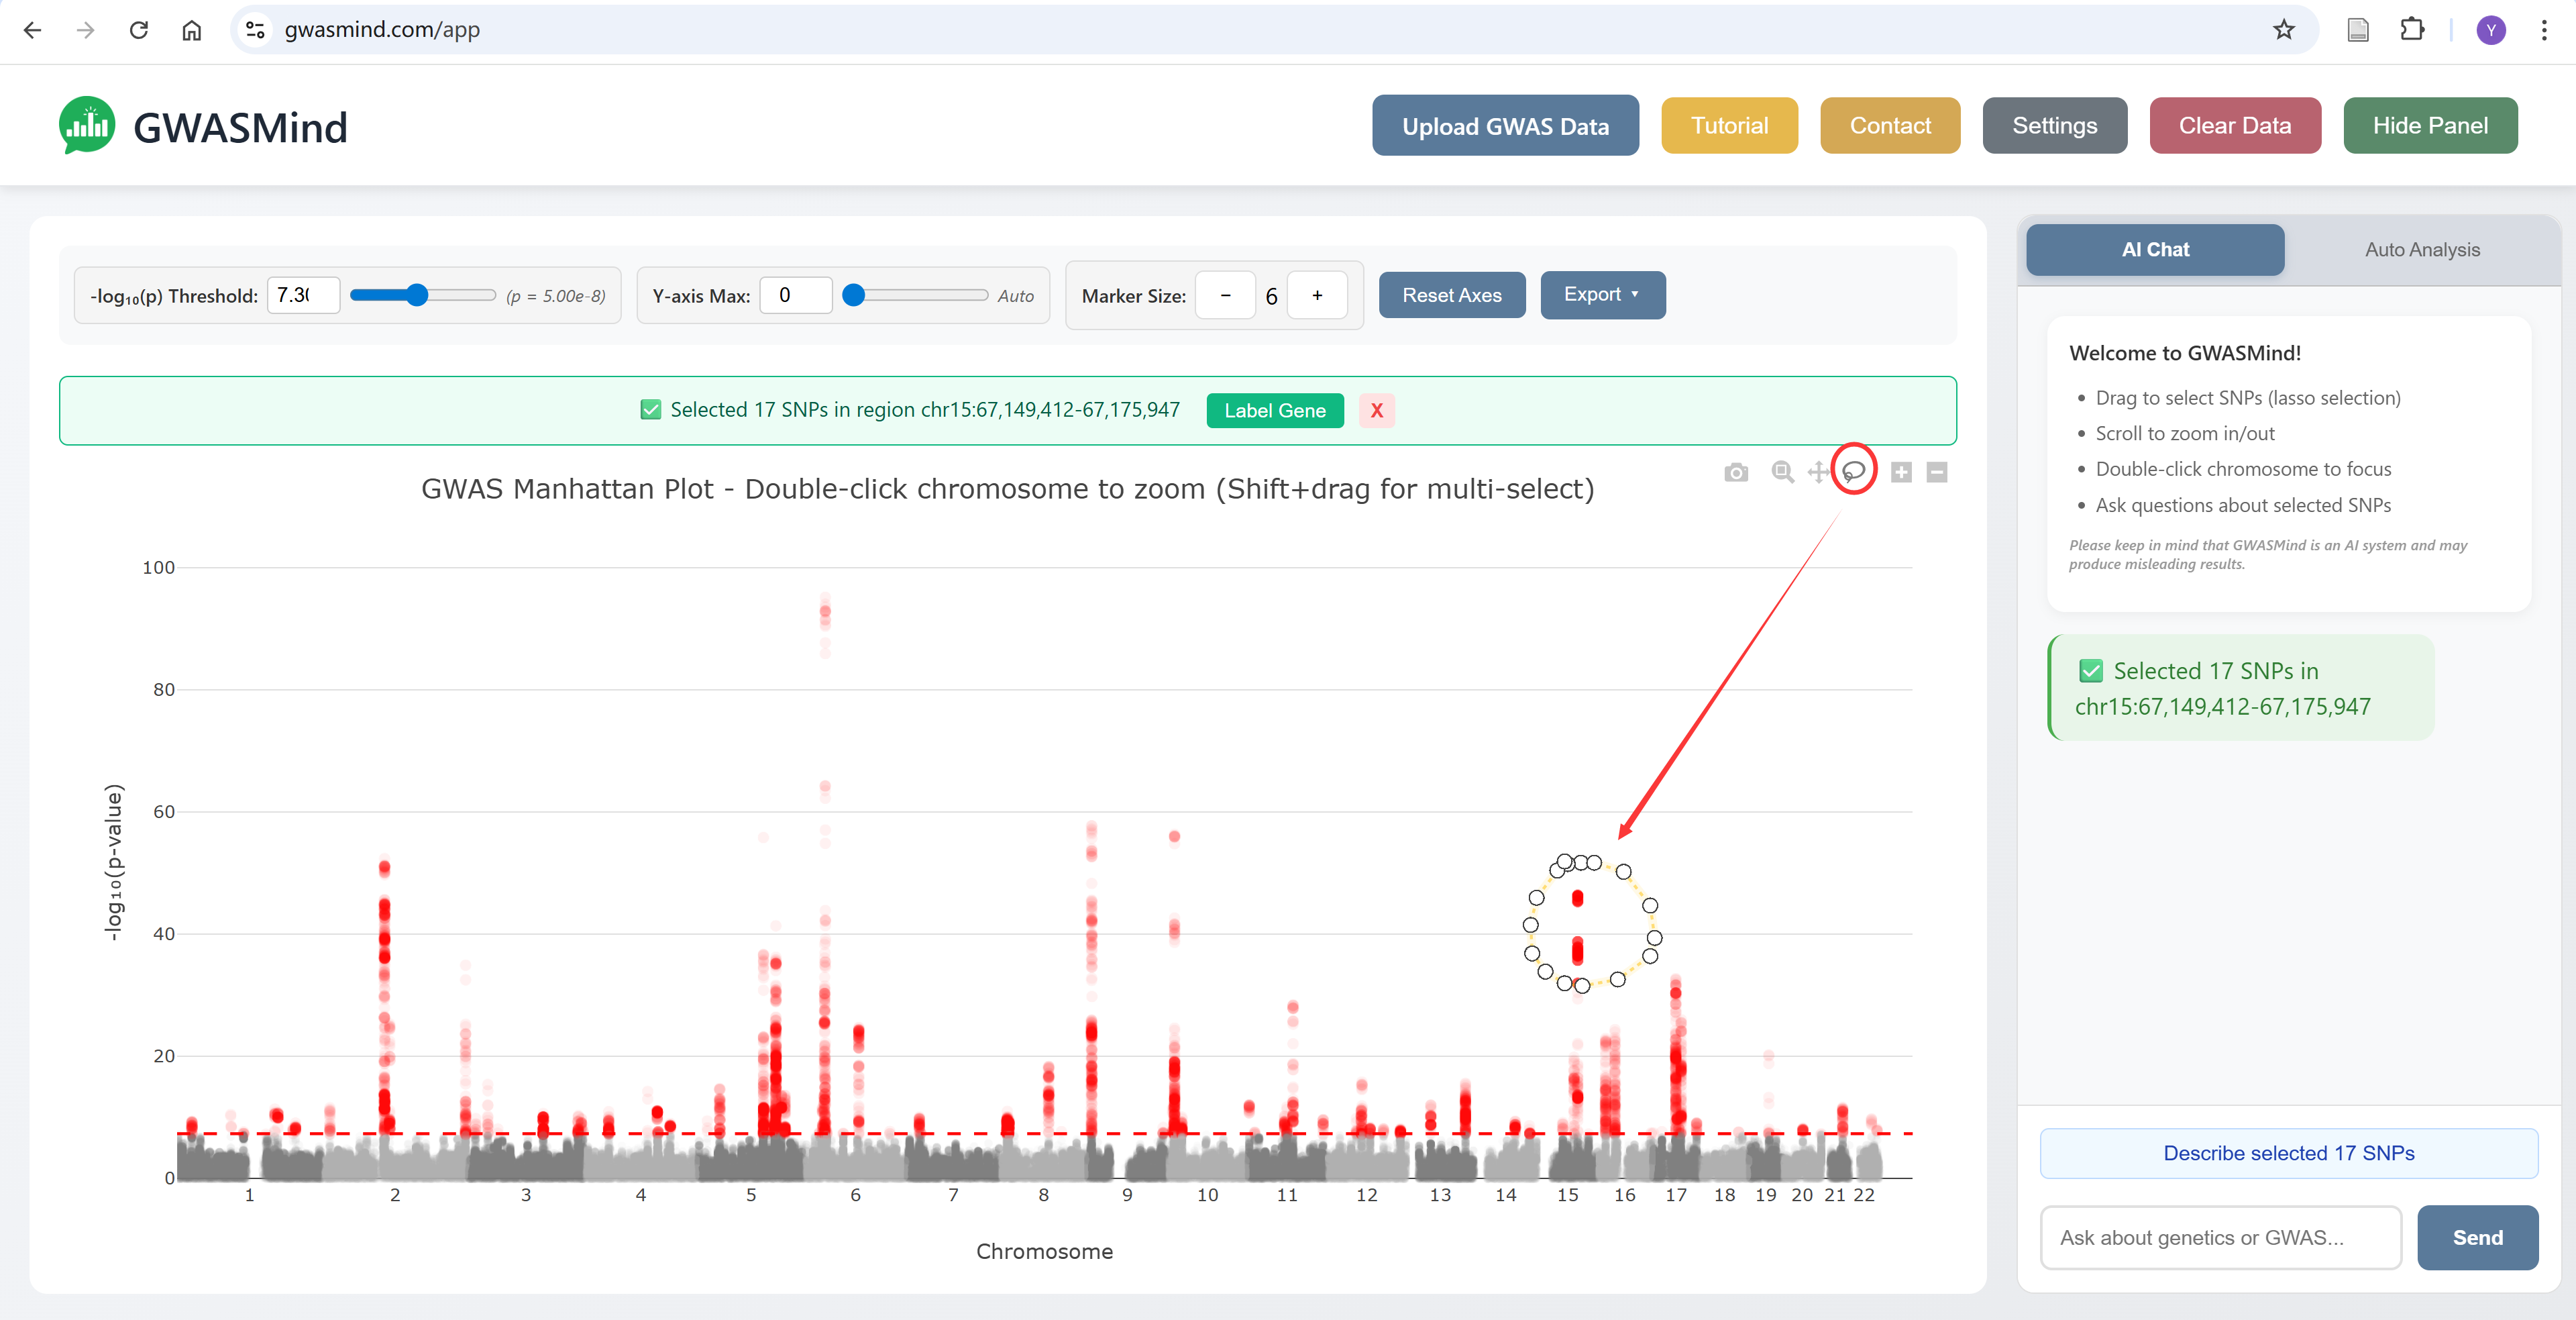
3. Interactive Manhattan Plot
The Manhattan plot is the main visualization, displaying -log₁₀(p-value) across all chromosomes.
Navigation Controls
| Action | Description |
|---|---|
| Scroll | Zoom in/out on the plot |
| Drag | Lasso selection for regions of interest |
| Shift + Drag | Lasso selection for multiple regions |
| Double-click on chromosome | Focus on that chromosome |
Plot Controls
- Threshold slider – Adjust the significance threshold line
- Y-axis Max – Set maximum -log₁₀(p) value displayed
- Marker Size – Increase or decrease point size
- Reset Axes – Return to full chromosome view
- Export – Save plot as PNG, SVG, or PDF
Lasso Selection
Draw a selection around SNPs of interest to analyze them:
- Click and drag on the plot to draw a selection region
- Selected SNPs will be highlighted
- A panel will show the selection summary
- Click "Label Gene" to annotate the lead SNP
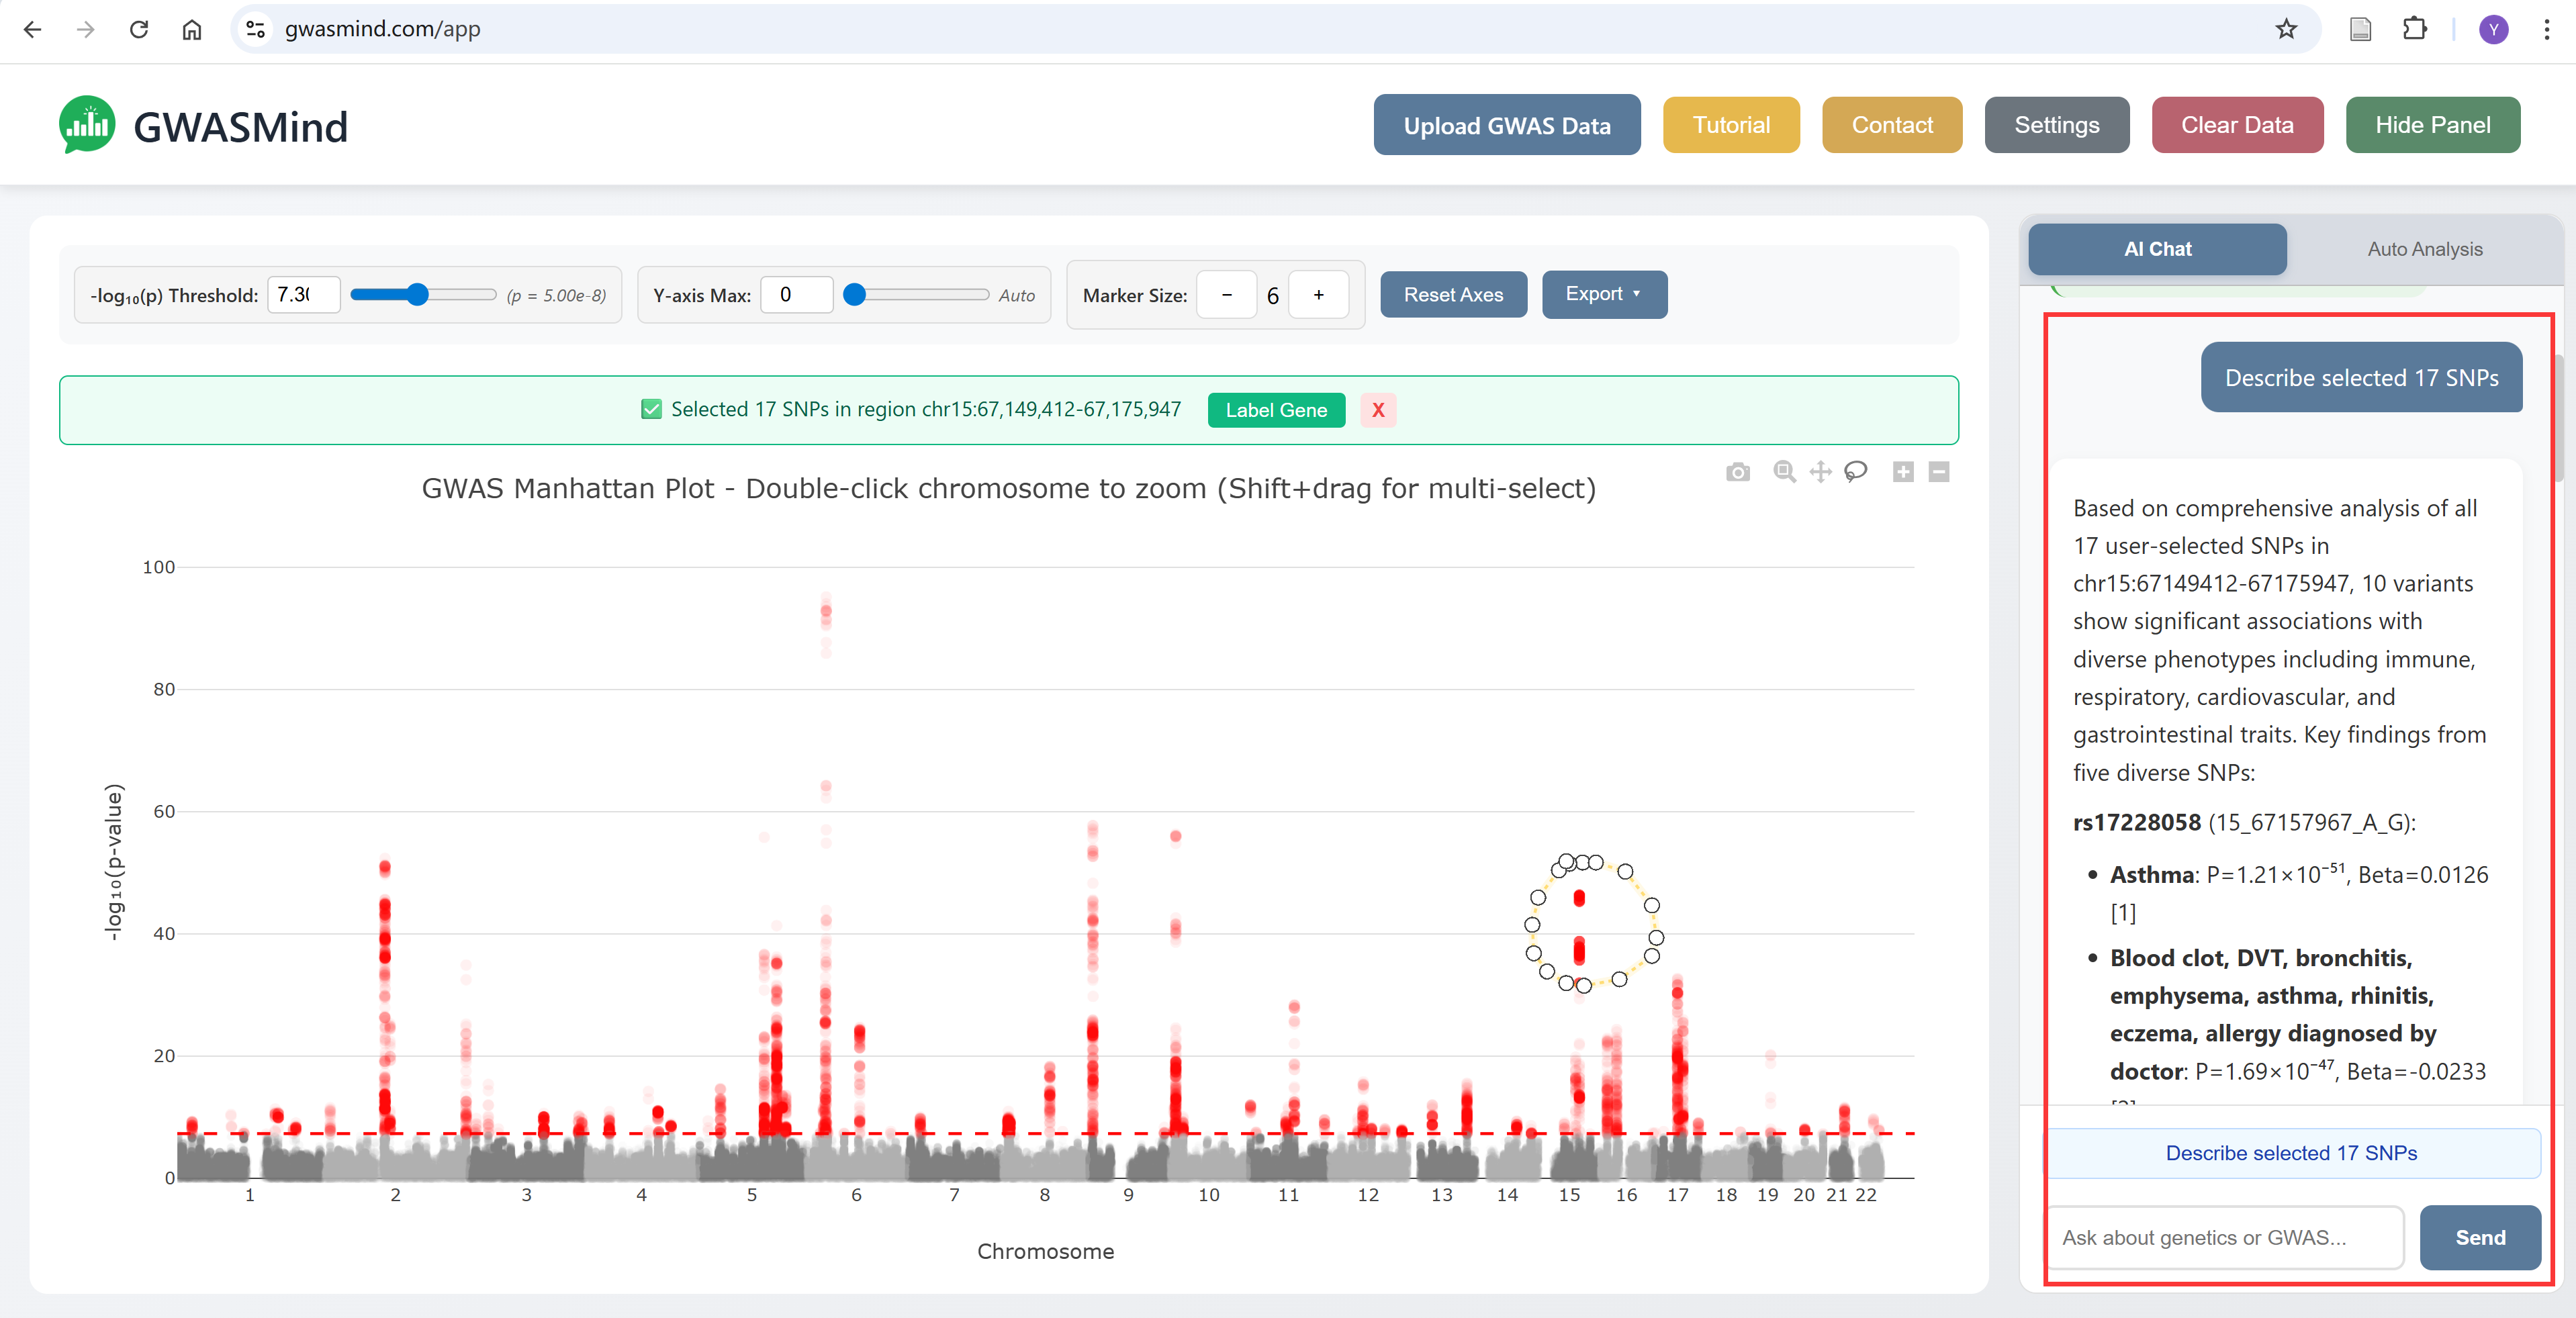
4. AI Chat Assistant
The AI Chat panel allows you to ask questions about your selected SNPs and receive context-aware responses.
How to Use
- Select SNPs using the lasso tool on the Manhattan plot
- Click the "Describe selected SNPs" quick prompt, or type your own question
- The AI will analyze the selected region and provide insights
Example Questions
- "Which genes are associated with these SNPs?"
- "Describe selected XXX SNPs?"
- "What diseases have been associated with these SNPs?"
- "Explain the biological function of [gene name]"
Tip: Please keep in mind that GWASMind is an AI system and may produce misleading results..
5. Auto Locus Annotation & Gene Prioritization
The Auto Analysis feature provides comprehensive annotation and gene prioritization for multiple GWAS loci at once.
Input Format
Prepare a file with your significant loci in one of these formats:
Format 1: rsID + Locus ID
rsid,locus_id
rs1002706,1
rs76527307,2
rs12345678,3
Format 2: Full coordinates
chr,pos,ref,alt,locus_id
1,169519049,T,C,1
1,206653061,G,A,2
2,102847563,A,G,3
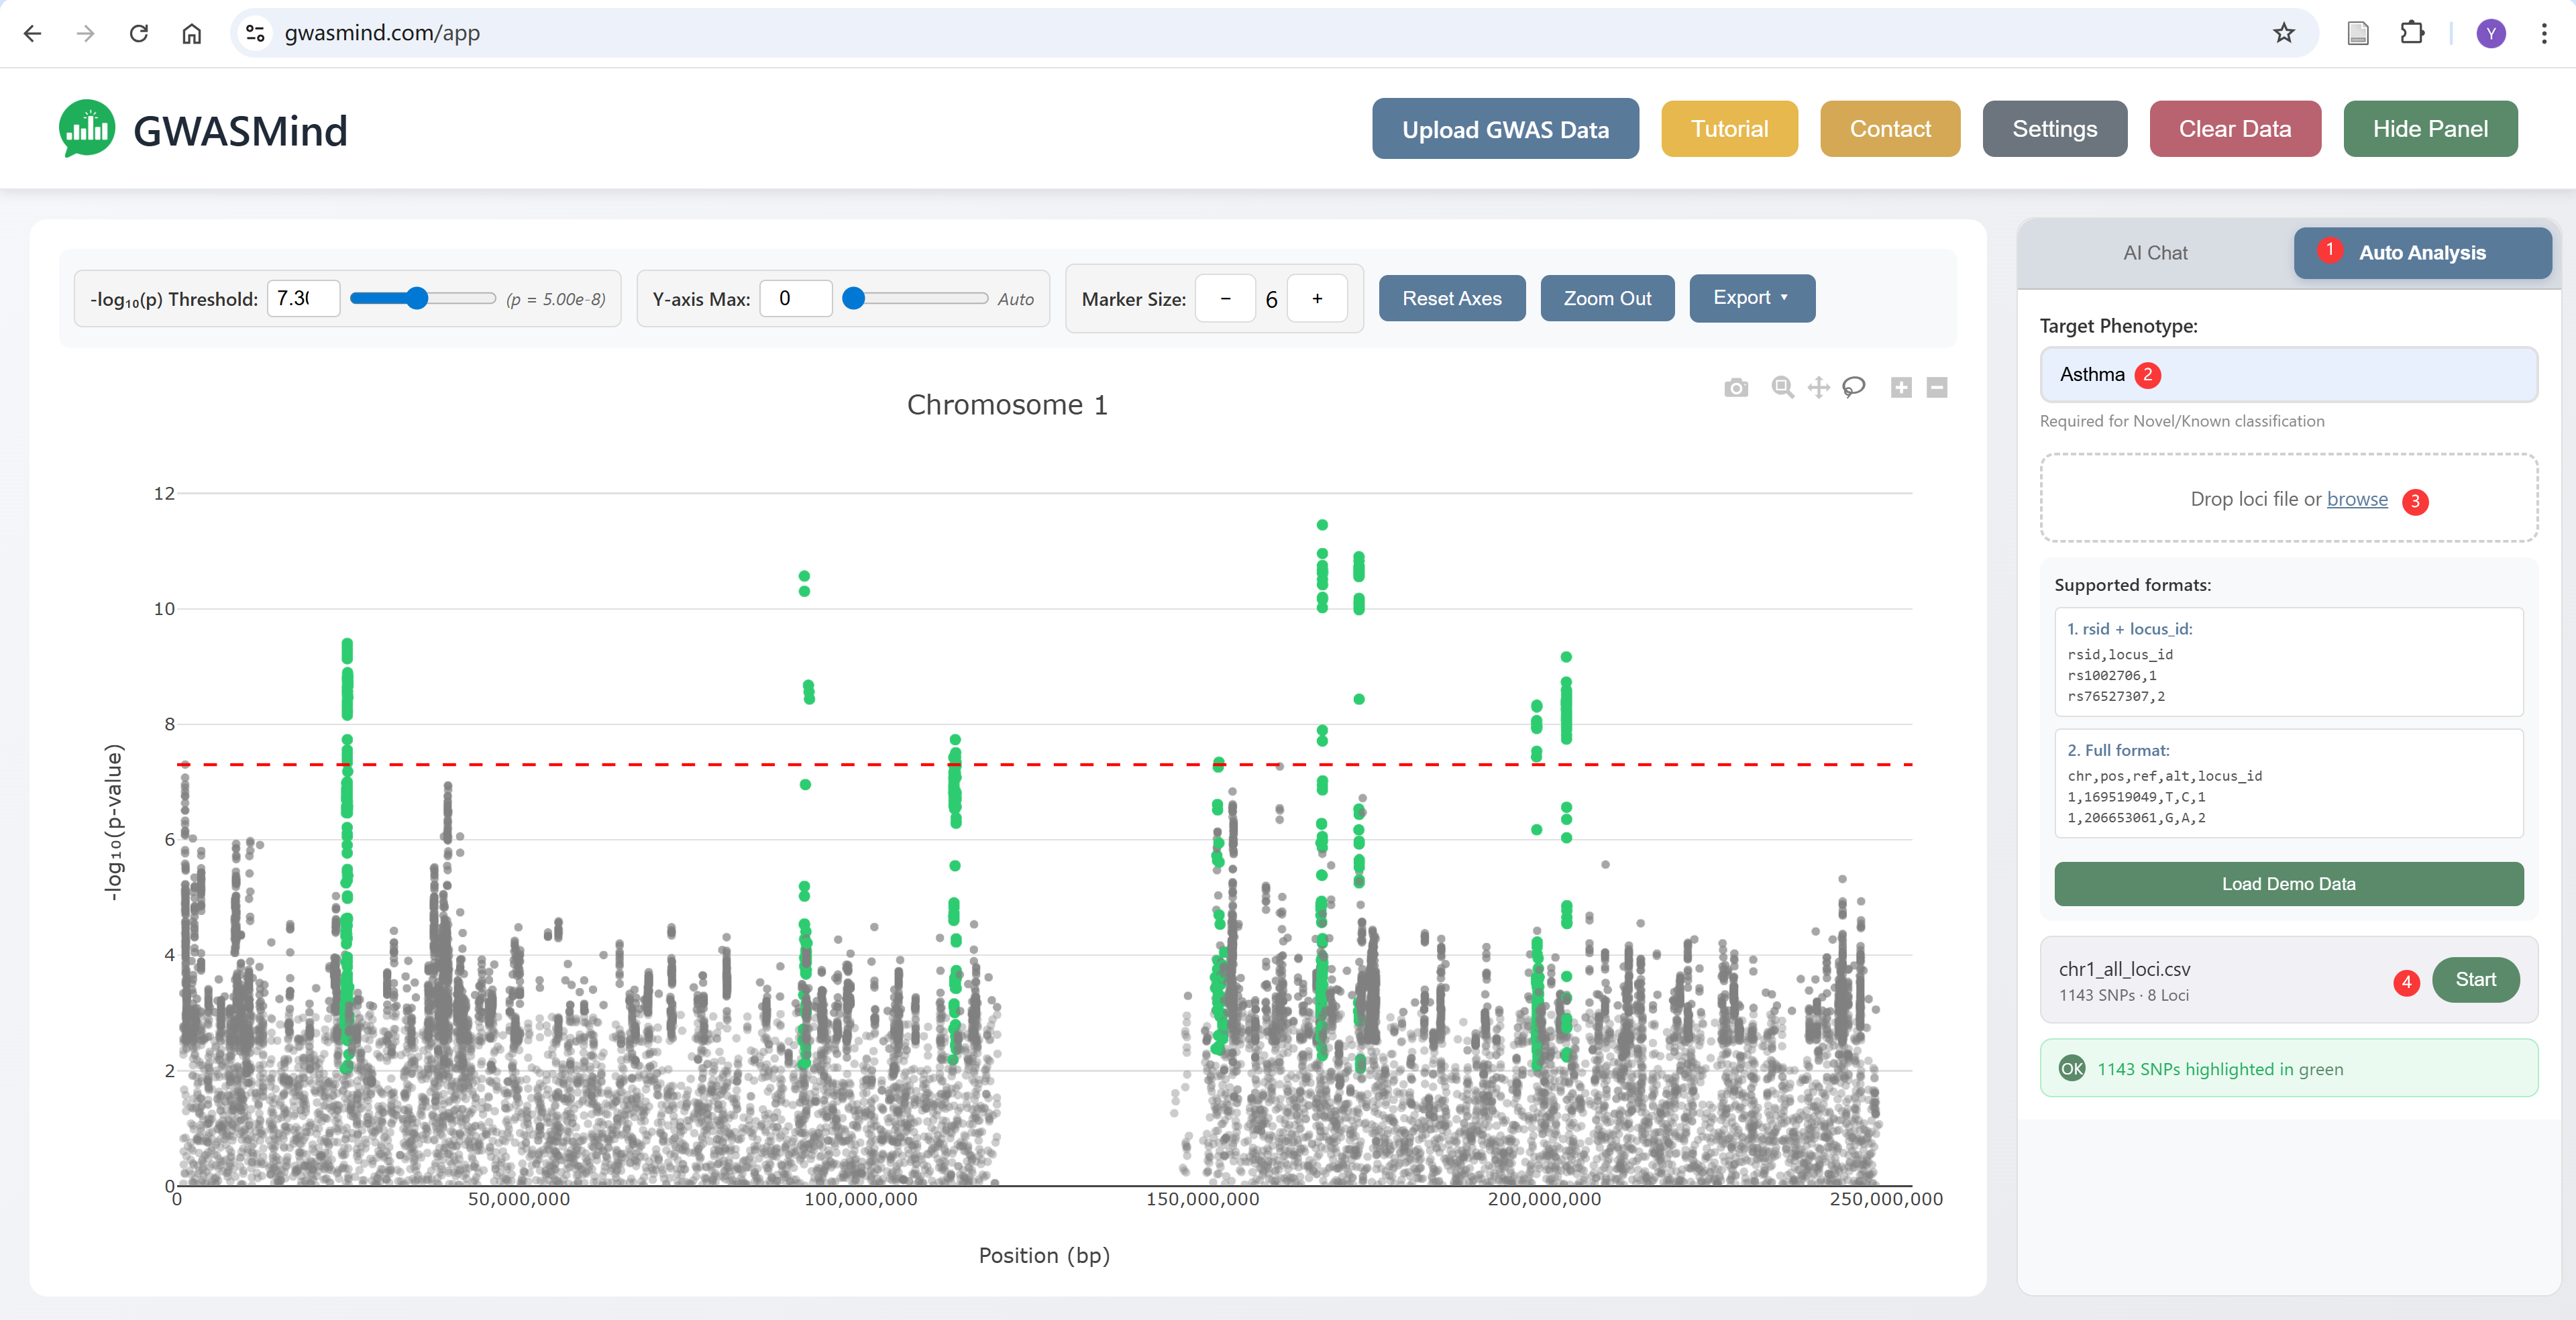
Analysis Steps
- Switch to the "Auto Analysis" tab in the right panel
- Enter your target phenotype (e.g., "Asthma", "Type 2 Diabetes")
- Upload your loci file or drag-and-drop
- Click "Start" to begin the analysis
- Watch real-time progress as each locus is annotated
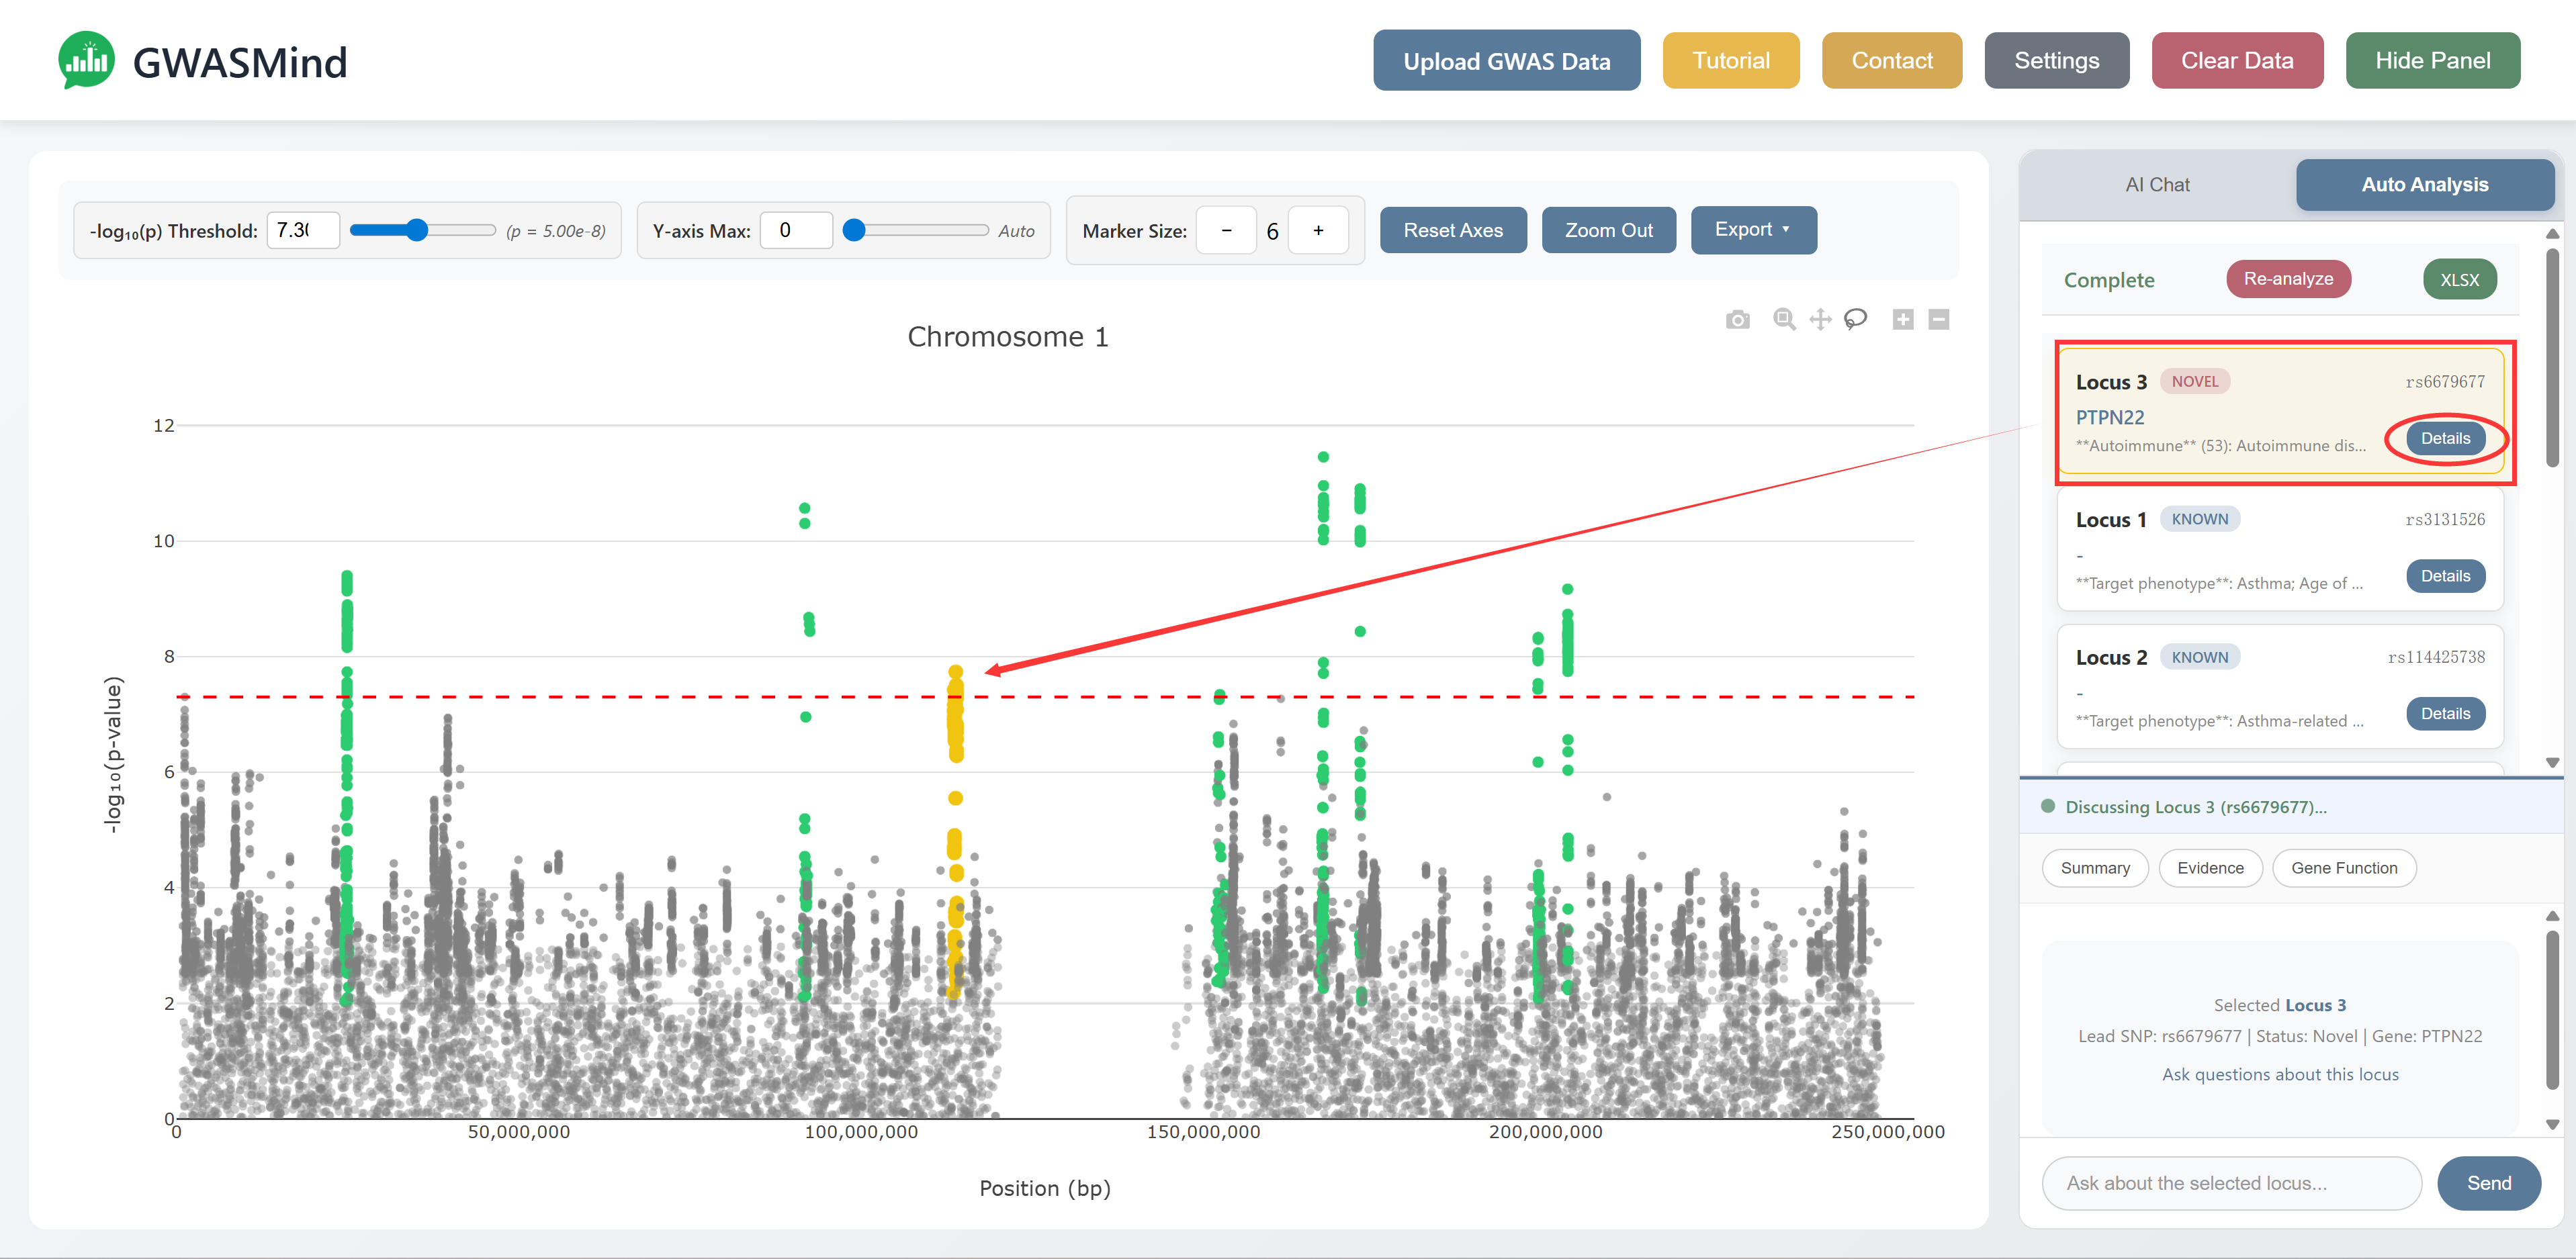
Results
For each locus, GWASMind provides:
- Basic Info – Chromosome, Novel/Known status, SNP count, lead SNP position and significance
- GWAS Associations – Previous associations grouped by category (Autoimmune, Blood Cells, Respiratory, etc.)
For Novel loci:
- Candidate Genes – Prioritized causal genes
- LLM Reasoning – AI-generated summary with detailed gene evidence including:
- Molecular QTL/Colocalization data (eQTL, sQTL, pQTL with P-values and effect sizes)
- Enhancer-gene links containing QTL variants
- Tissue expression profiles (TPM values)
- Functional annotations (GO terms, pathways)
- Full references with PMIDs
For Known loci:
- References – Published studies reporting this locus for your target phenotype
- Classification Reasoning – Explanation of why this locus is classified as "Known"
Export Results
Click the "XLSX" button to download a comprehensive Excel report containing all analysis results.
6. API Configuration
To use the AI features, you need to configure an LLM API. GWASMind supports multiple providers.
Supported Providers
| Provider | API Base URL | Notes |
|---|---|---|
| DeepSeek | https://api.deepseek.com |
Recommended, cost-effective |
| OpenAI | https://api.openai.com/v1 |
GPT-5.1 |
| Any OpenAI-compatible API | Custom URL | - |
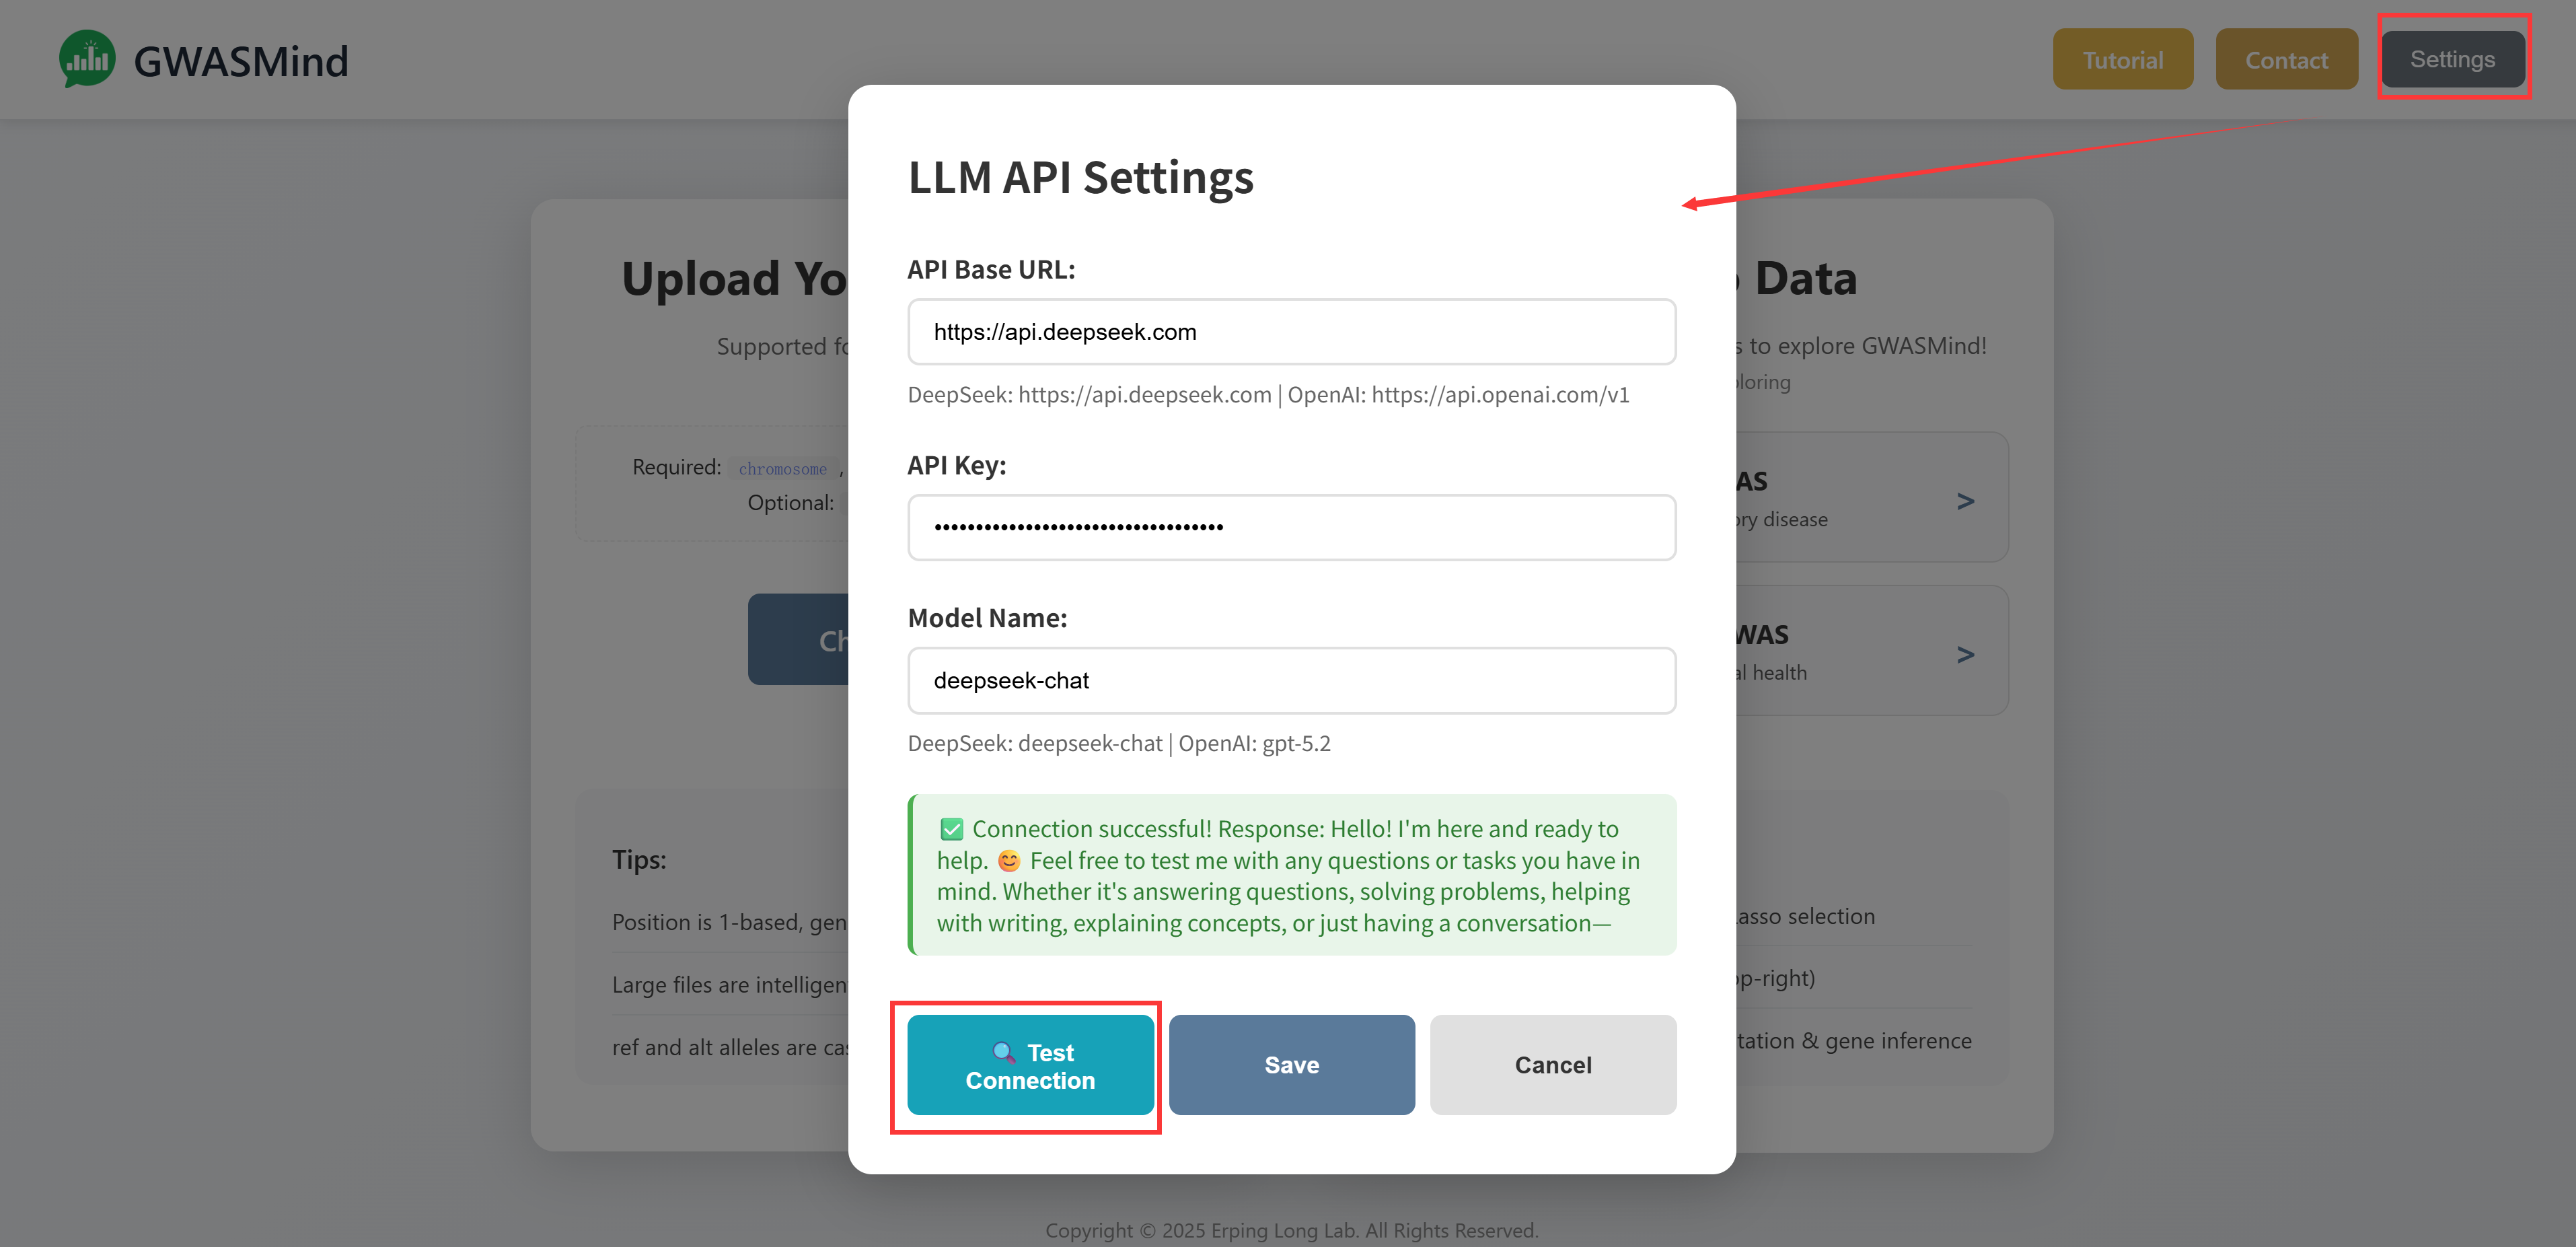
Configuration Steps
- Click the "Settings" button in the header
- Enter the API Base URL for your provider
- Enter your API Key
- Specify the model name (e.g.,
deepseek-chat,gpt-5.2) - Click "Test Connection" to verify
- Click "Save" to store your settings
Privacy: Your API key is stored locally in your browser and is never sent to our servers. All AI requests are made directly from your browser to the LLM provider.
Need Help?
If you have questions or encounter issues, please visit our Contact page or reach out to our team.